Looking to take a step out of your comfort zone and learn about something that will be seriously useful in your career? I’d recommend Casey Lichtendahl’s second year (SY) Forecasting elective. You learn how to write code in a programming language called R, on top of learning advanced statistical concepts, including time series, advanced regression, and machine learning. If DAO* is DA**’s nerdier older brother, Forecasting is DA’s rocket scientist uncle.
But don’t let that dissuade you—you’ll be surprised how valuable this course will be for your career. After learning R as a master’s student at Stanford in the ’90s, Casey says he was surprised by “this whole trend that has emerged almost ten years later that regular practicing managers want to learn. I hear about more and more practicing managers that have R code books on their shelves and they’re taking these Coursera courses. It’s a validating experience to come across…MBA students who want to learn this stuff.”
During the course, we tackled problems like whether to expand the UVA hospital’s Neonatal care wing based on trends in the area’s birth rates, whether you could predict stock market returns, how to identify which Yelp reviews are the most helpful, and even whether you could predict which of the Titanic’s passengers survived. We also got the opportunity to work with recent alum, Kyle Redinger (‘12) on a challenge he was facing in his start-up, VividCortex, as well as to talk with Rohit Gupta (’13) about his work on big data at HomeDepot.com while he served as our unofficial teaching assistant.
Casey designed the course to be taken in one of two ways. The first is the more intense way, building mastery, in which you “actually [learn] the R code, you [dive] deep into the concepts, actually [try] to understand what these models are, why they work, [and] how you implement.” Take this approach if you’re one of those people who, as Casey says, “feel like they’re going to have some exposure” in their careers directly to forecasting, “they’re going to eventually want to learn this, and they’re want to take that first step.”
The second way to take the class, which Casey says he’s committed to offering, is to “tour” or gain an appreciation for the concepts. This is for people who are “maybe…never going to take the deep dive on the job, but they want the exposure now because they’re going to be in and around people who are deeply into this stuff,” Casey explains. Taken this way, the course allows you to make the connection between a business problem and what tools could be used to solve it, but then delegate authority to someone else to actually use the tools. In reality, it seems that this is the way that most of us will use this knowledge in our careers.
As seems to be a theme in SY, we acquired several new pieces of software throughout the class. In addition to R Studio where we worked with R, we also learned how to use import io: a tool to “scrape” data from websites into an analyzable form, and Tableau: a tool to visualize data for better understanding and presentation. I won’t get into it too deeply, but this is some seriously cool stuff. You can check out Tableau visualizations on their “viz of the day” site or through a couple of examples from our final projects at the bottom of the post.
Completely different from other courses, the forecasting elective evolved as it went. That’s not to say that Casey hadn’t done his homework and put together an extremely well thought out course before day 1. What I really mean is it was mostly “open source”: our textbook was online and a new edition appeared in the middle of the term; different students in the class led demonstrations of software and techniques that Casey discovered they knew, including Tableau and import io; and Casey put together extra evening workshops for topics we needed to discuss and practice more.
As the field of data science continues to evolve, so will the course. Next year, Casey plans formalize the inclusion of the tools showcased by this year’s students. He’d also like to involve UVA’s new Big Data Institute to expose students to true big data, “not these data sets that I give out with hundreds of thousands of rows and can actually be stored in your laptops’ memories.” Casey’s hopes are that students get the opportunity to not “just talk about [big data], or read about it, or hear that others have worked in it,” but to actually “get our hands dirty with it.”
Most importantly, though, Casey emphasized that it’s alums that will be the engine for the course’s evolution:
“I want to urge the student body to embrace the idea that these courses depend on you: one year out, two years out, ten years out. The material for these courses has to get refreshed over the years and most electives work like this. You take 15 class sessions and maybe three, sometimes more, get dropped and three or more new cases come into that course. That’s a pretty big churn rate and it happens pretty much every year. …Where do those cases come from? They come from alums who are at the companies, who are facing these new and real challenges now. And they’re getting in touch with [professors] and feeding [them] enough information to write a really good case so that future generations of students can learn from the latest and greatest problems that are being faced by real managers.”
In fact, at least one (probably more) of the class’s final projects will be turned into a new case for next year’s class. Do yourself a favor and set aside some bid points for this one.
*Decision Analysis and Optimization, First Year term 5 elective
**Decision Analysis, First Year core class
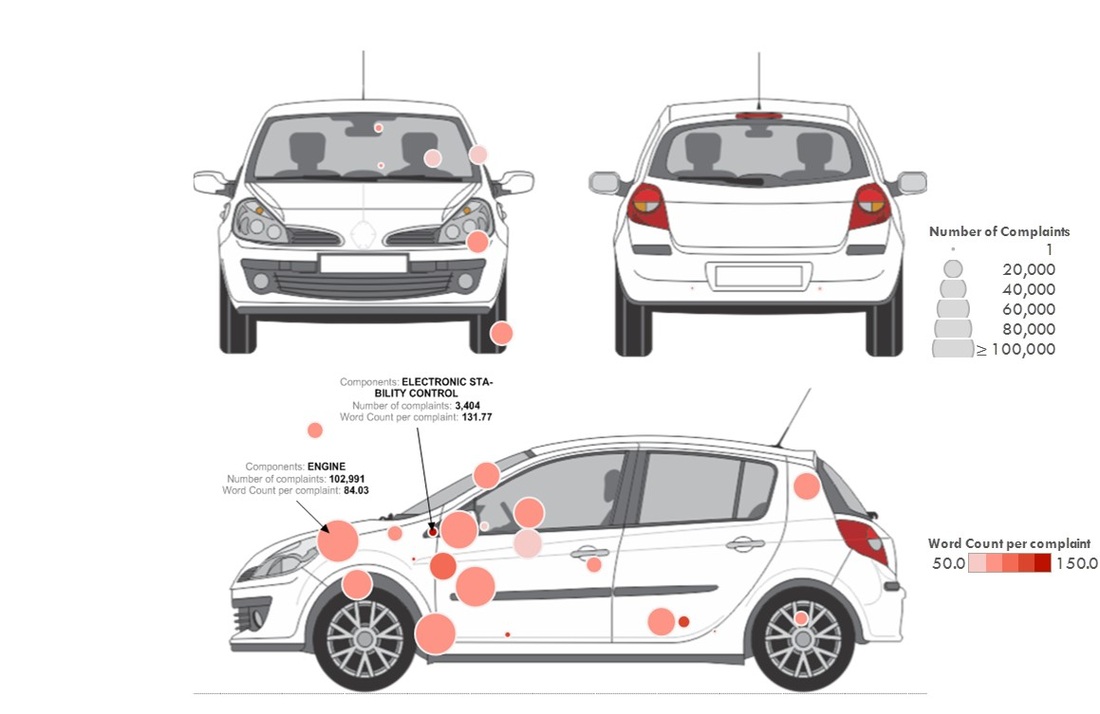
Predicting Car Problems: What Consumers Frequently Complain About (by Amico Bai, Anil Demir, and Ronald Simorangkir)
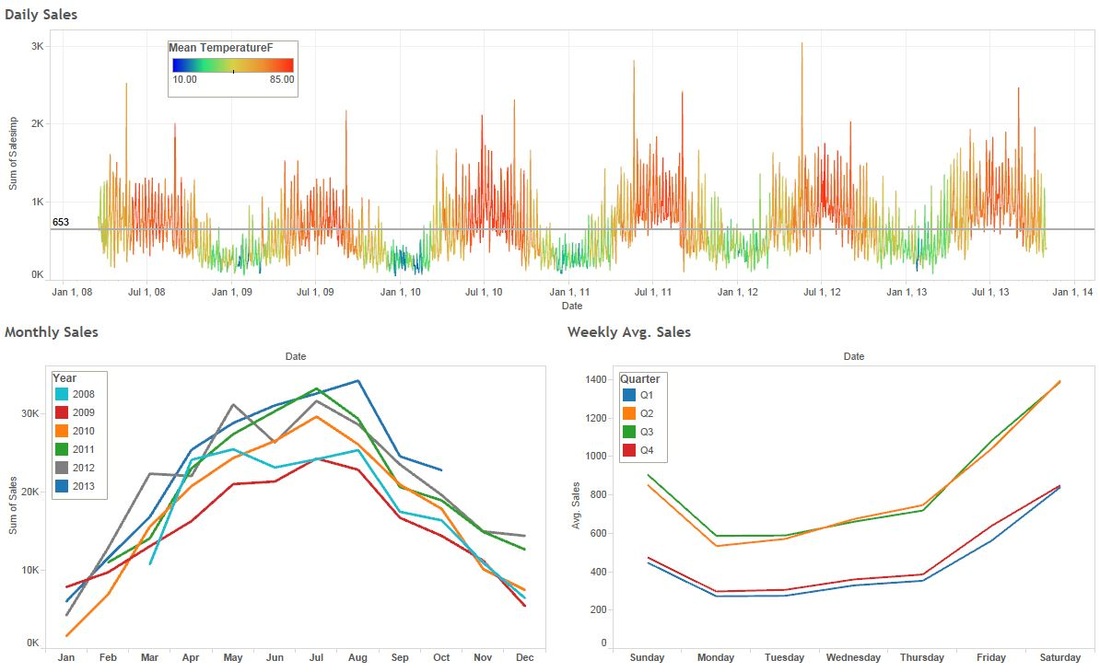
Understanding Multi-Season Variability at gelato shop, The Split Banana (by Andrew Robertson, Prajakta Damle, David Marriott, and Matt Attaway)
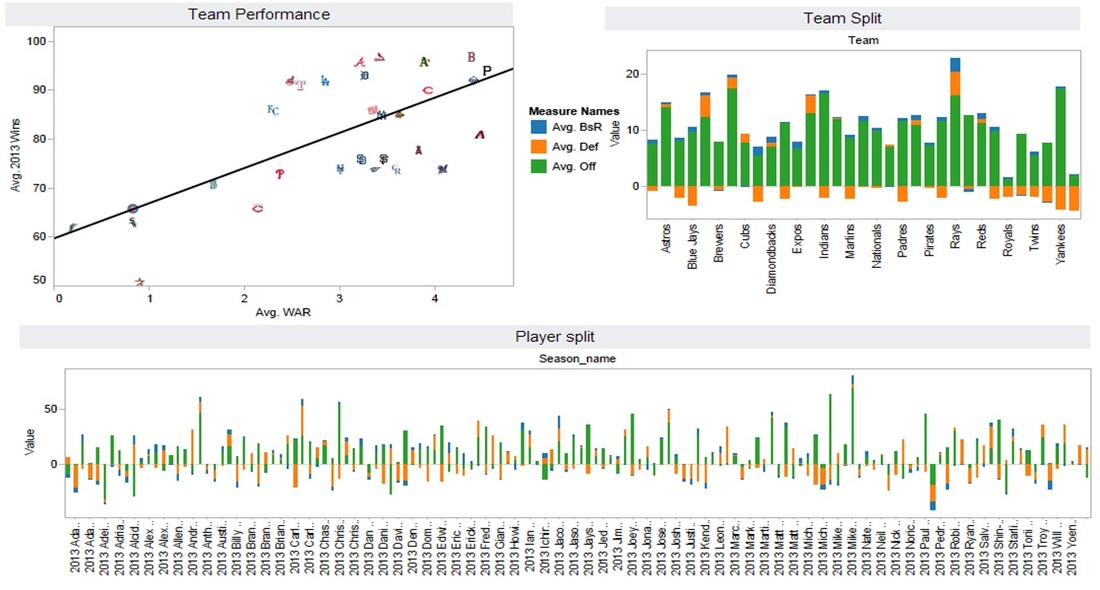
Forecasting Baseball Player Performance (by Ben Midanek, John Molster, Jon Roberts, and Nate Weir)
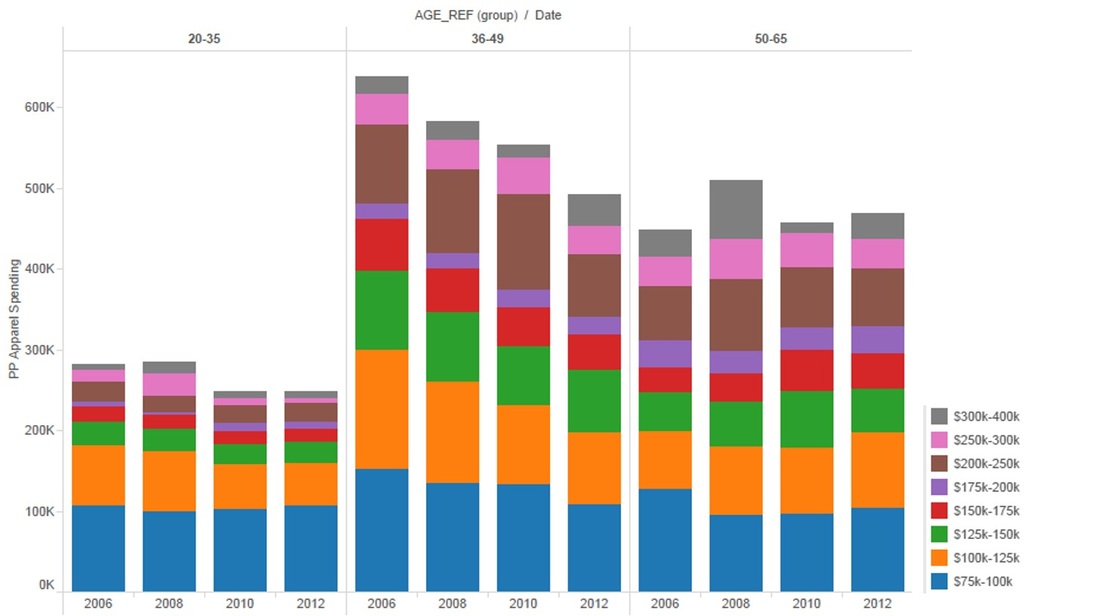
Per Person Apparel Spending by Income over Time (by Eliav Bitan, Yue Zhu, Michael Conroy, and Amanda Miller)
 RSS Feed
